When it comes to your content marketing, don’t throw spaghetti at the wall and hope that it sticks. Refer to your analytics to understand what’s working and what isn’t so you can adjust accordingly moving forward!
This is one of the many reasons why I love HubSpot (as if you didn’t already know that). When you go through the onboarding process, you can select various content marketing reports to add to your dashboard for easy access and viewing. HubSpot already has templates for these, which means you don’t need to build them out yourself- even better!
Check out the top six reports I recommend my clients use to better understand the results of their content marketing efforts (specifically).
Blog Reporting on HubSpot
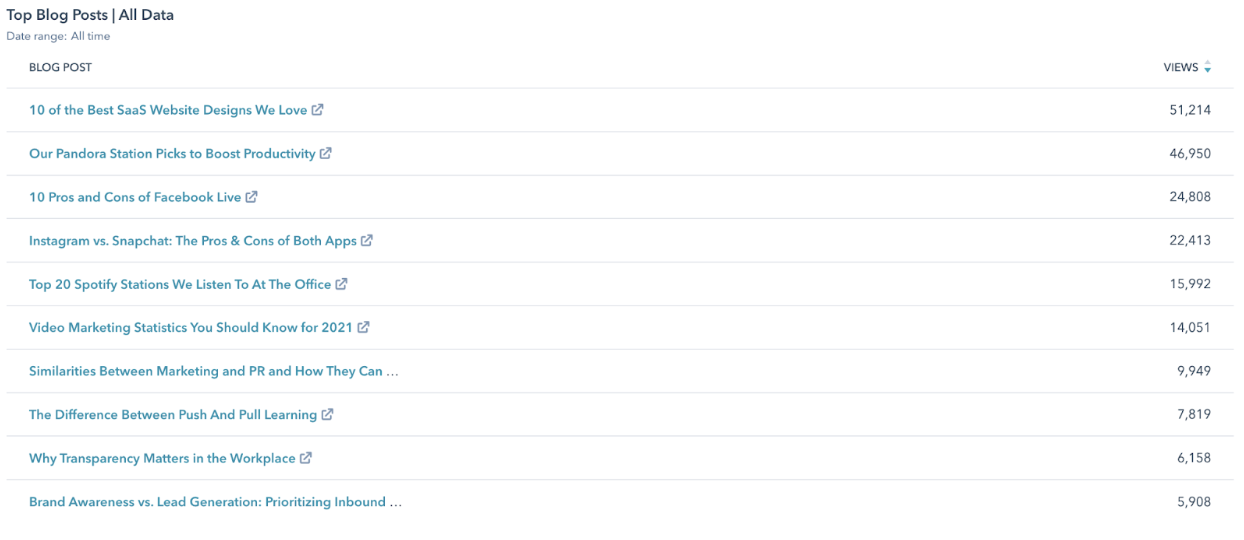
One report I love looking at relating to blogging is the top 10 blog posts. You can filter this by the date range and blog properties, allowing you to refine or expand your search as you see fit. That means that if you want to view the performance of your blog posts by week, month, quarter, or year, you have the ability to do so! You can also compare dates if you wanted to find out how your blog posts performed one year ago vs today.
With the blog properties, you can break it down by the blog author, date, title, tag, and more, helping you to see how blog posts that fit a certain criteria perform.
Why is this reporting important? It’ll not only help you realize if your blogs are working or not but it’ll also give you an idea of blog posts that you can reshare on social media or new blog posts you can write based on topics that are performing well! For example, you’ll see in the screenshot above that design and visualization tend to be popular blog topics I’ve written about, which means it’s something that my audience is interested in, and it may be something I’ll want to write more about.
Attribution Reporting on HubSpot
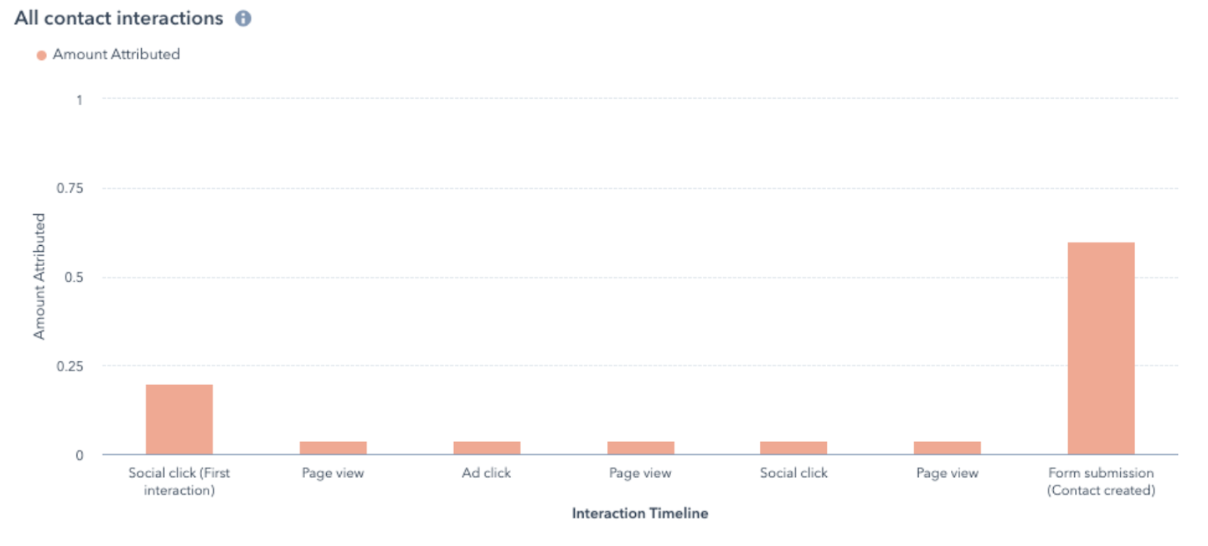
Want to know what exactly led to the creation of a contact, the closing of a deal, or an increase in revenue in HubSpot? That’s where attribution reporting comes in! There are different conversion points to follow for contact creation compared to deals and revenue.
For contact creation, you’ll want to pay attention to:
- First interaction: typically the first time the contact visited your website
Last interaction: the last action the contact completed before becoming a contact
As for deals and revenue, those conversion points include:
- First interaction
- Lead creation (same as last interaction)
- Deal creation: the contact’s last interaction before they started a deal
- Closed-won: the contact’s last interaction before the deal was closed
The really interesting part about these attributions is you can see exactly what those interactions were. That means that if the first or last interaction someone took came from an email, blog post, or social media post, you’re able to see that information, therefore giving you a better understanding of what piece of content converted the user. I’m always curious to see what made people take the plunge!
Landing Page Reporting on HubSpot
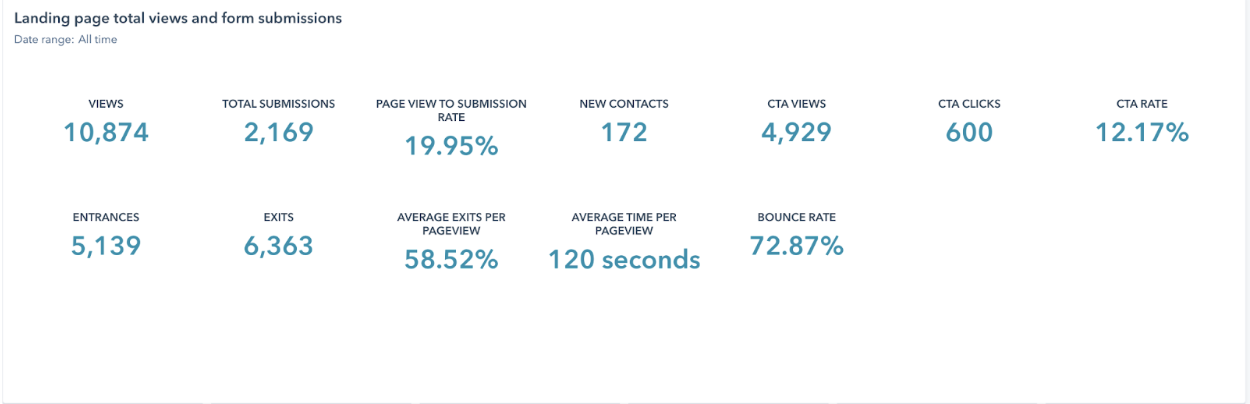
Are you interested in seeing how many views, conversions, clicks, and more generated by one of your landing pages? You can! This report shows you more than 10 stats, all of which can be filtered by date and landing page properties.
What do these stats mean?
- Views: the number of times the landing page was viewed
- Total Submissions: the number of form submissions on the landing page
- Page View to Submission Rate: the number of submissions divided by number of sessions
- New Contacts: the number of new contacts created from the landing page
- CTA Views: the number of times the CTA has been viewed
- CTA Clicks: the number of items the CTA has been clicked
- CTA Rate: the number of conversions divided by number of views
- Entrances: the number of times this landing page was the first one viewed
- Exits: the number of items this landing page was the last one viewed
- Average Exits Per Pageview: the average number of times this landing page was the last one viewed
- Average Time Per Pageview: the amount of time someone spends on this landing page
- Bounce Rate: the percentage of time that a website visitor didn’t move past that page
If you discover that one of your landing pages has many views but very little submissions, that’s an indication that the landing page itself may need some adjusting, which will help you to get a better performance. On the other hand, if you see that one of your landing pages converts really well, you’ll want to make a mental note to continue to promote it!
Campaign Reporting on HubSpot
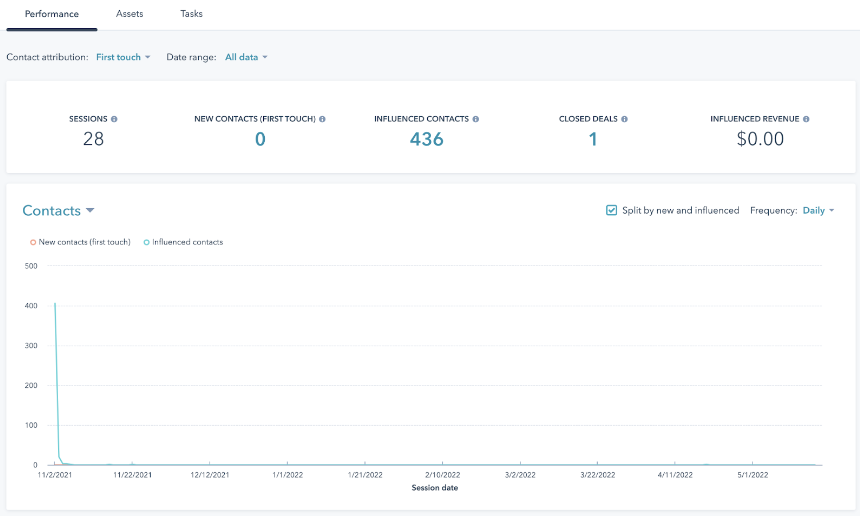
Did you run a campaign and want to see how it performed? HubSpot allows you to track the success of a defined marketing initiative, helping you to get granular with the data you view! When selecting a campaign report, you can see the following reports broken down after it:
- Contacts: total number of new contacts and influenced contacts (contacts that engaged with one or more asset of the campaign)
- CTAs: how many times the CTAs were viewed and clicked
- Emails: total number of opens and clicks from the emails associated with the campaign
- Social posts: how many clicks came from each social media post under the campaign
- Website pages: the total number of clicks from the page associated with the campaign
- Traffic: where views, sessions, and contacts came from
This means that if you create content to achieve a specific goal–such as recruiting, encouraging people to register for a webinar, or publishing a new blog post–you can see how the content you created for that campaign performed and analyze whether or not it helped you reach your goal.
Social Media Reporting on HubSpot
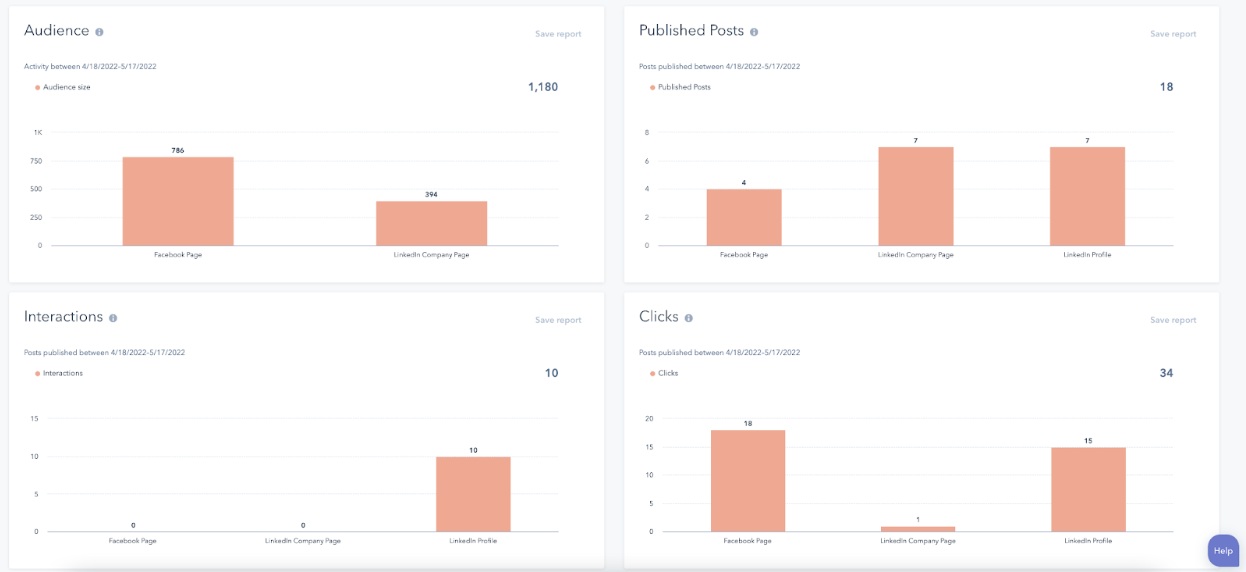
The social media reporting in HubSpot is one that companies tend to love the most! By offering a wide variety of data, you’re able to see how your audience has grown, how your posts have performed, and what results social media has brought across all of the platforms you’re using. What’s even better is you can see the top posts within the date range you’ve specified, which will help you with planning future posts by showing you what performs well and what doesn’t.
If your company is really active on social media, this report will help you to understand how your efforts are paying off and what you can do moving forward to continue to improve!
Email Marketing Reporting on HubSpot
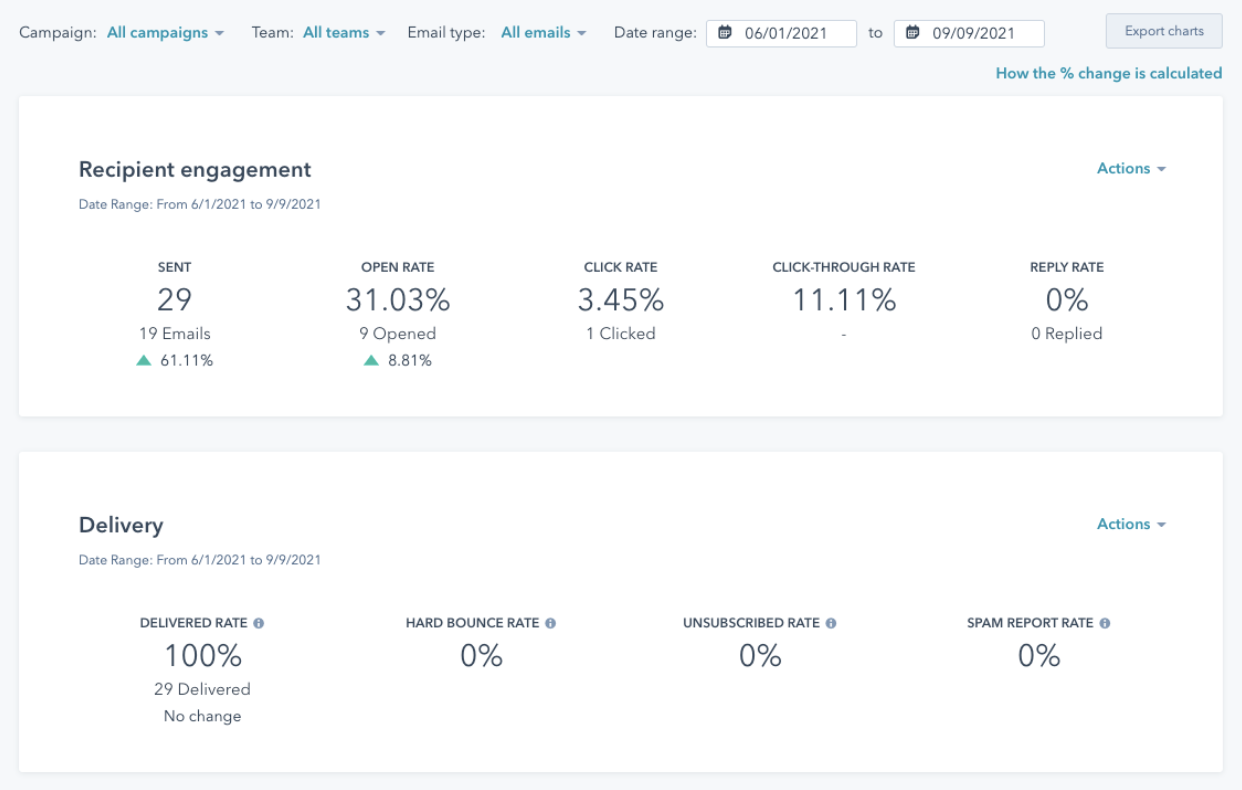
Do you know if your emails are getting opened, never mind if they’re getting clicked? Viewing your email marketing reports in HubSpot will tell you that! In any given time period, you can head to your dashboard to see:
- The total number of emails sent
- Their open rate
- Their click rate
Not only is this helpful for regular newsletters you send but also for lead magnets that you set up, allowing you to see how many people have opted in to receive those resources and whether or not they’ve opened the emails.
Once you set up your dashboard with all of these reports, you’ll be amazed at how convenient it is to view them all in one place and see how your different marketing channels work together!