Whether you’re new to running Google Ads or a more experienced digital marketer, the platform can be a bit overwhelming at times. There are endless amounts of reports and metrics that you can analyze.

But, there are definitely a few reports we reference more than others. These reports have one thing in common: they provide clues to help you figure out how to optimize your campaigns to better target your audiences and improve your cost efficiency. In turn, this is how you can increase leads and sales for your business.
Here are four of our favorite reports on the Google Ads platform.
1. Auction Insights
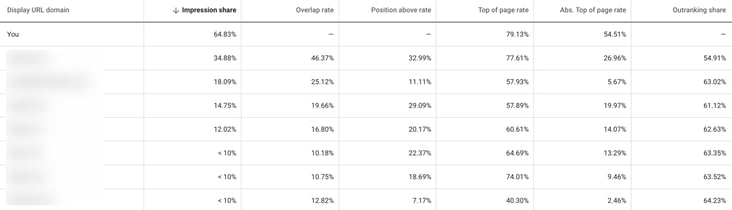
The Auction Insights report allows you to see all of the other domains competing in the same Google ad auction as your domain. The report only shows domains that have geographic targeting overlapping with yours, so you should recognize some competitor companies here.
One of the most important things this report shows us is the trend of the auction environment over time. For this reason, we have found that the most effective way to use this report is to compare date ranges of at least 2-3 weeks of data. There are a few key things we like to keep an eye on when comparing data from these date ranges:
- Are there new competitors coming into or leaving the auction in your area?
- Are there any competitors significantly moving up or down the list?
At a more granular level, you can gauge your performance in the auction relative to your competitors’ performance for metrics like top of page rate. We can then use this information to help us make important decisions about bidding and budgeting moving forward. The report provides 5 different metrics to help us make these decisions: impression share, overlap rate, position above rate, top of page rate, and outranking share.
When analyzing our own performance over time, we ask ourselves a few key questions:
- Are any of these competitors consistently outranking us or in the positions above us?
- Is our relative Impression Share going up or down significantly?
Competitors are constantly entering and leaving auctions and making budget and bidding changes so it is important to keep an eye on the auction landscape. It’s equally as important to be able to understand what the data in an Auction Insights report is telling you as it is to be able to make the necessary adjustments to maintain a consistent ad position at the top of the SERP. After answering the questions above, you will be able to tell if you may need to make changes to your bidding or budgeting moving forward.
Blog: How to Get the Best Results with Google Ads on a Small Budget
2. User Location Report
The User Location Report is a list of the best-performing geographic areas you are targeting with Google Ads. The report can show places where your potential customers are likely to be located, or are regularly located. We often use the user location report in combination with sales data from a business’s CRM. The way we analyze the user location report is dependent on the type of business running Google Ads.
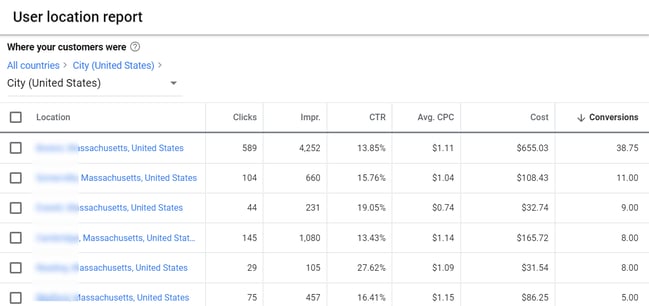
For example, imagine a brick and mortar business that allows customers to make online appointments, such as a spa. Many potential customers may not be willing to drive to the location because there are other competitor spas closer to them. We would not want to waste ad dollars on locations that customers consider too far of a drive. Instead, we want to target every zip code that would regularly generate customers.
We can analyze CRM sales data to determine where most of our customers live, then cross-reference that data with our user location report to determine the most cost-efficient geographic areas to show our ads. If we see that a certain area spends a lot of ad budget on clicks and traffic to the site, but those clicks do not regularly convert to appointments, we can assume this area may be too far of a drive, or perhaps there is a competitor spa nearby.
After you have run the User Location Report and determined which zip codes, cities or states are leading to the most and least qualified traffic, you can make adjustments to your targeting. This can be done by adding exclusions to areas that do not perform well, or by adding bid adjustments for certain areas that are performing better.
3. Day & Hour Reports
The Day & Hour Reports are some of the more self-explanatory, yet very useful reports offered by Google Ads. By running these reports, you can determine which days of the week and times of the day customers are most likely to engage with your ad and complete the conversion you have set up.
Depending on the business, industry and budget, it may make sense to adjust your ad schedule to only show on certain days of the week and hours of the day. Even the smallest changes here can make a big difference. For example, removing a few hours from your schedule can allow your ads to show more consistently during more opportune times.
Be sure to give your campaigns sufficient time to run before making any major ad scheduling decisions. You want to make sure you are able to make these decisions based off of a sufficient amount of data before prematurely blocking out times when customers might be likely to engage. We like to wait at least one month before making major ad scheduling changes.
4. Devices Report
The Devices Report allows you to break down your campaign by which type of device you are getting the most impressions, clicks, conversions, etc. from. The device types are computers, mobile phones and tablets.
Similar to Day & Hour reports, different businesses may have more success on different device types. For example, a restaurant may see better results from people searching on a mobile device because people are often searching for a place to dine out when they are on the go.
On the contrary, a B2B service may see better results on computers as operations managers may be doing a lot of their searching during the workday when they are at their desk.
If after analyzing the data from this report you are able to determine that activity from certain device types is more or less productive than others, you can go ahead and make bid adjustments for those device types. Bid adjustments are done as a percentage increase or decrease in your bids ranging from -100% to +900%. When it comes to bid adjustments, we like to start small (around a 5--10% adjustment), analyze the data for a month, and then determine if further changes are necessary.
Conclusion
The Google Ads platform can certainly be overwhelming at times with so many reports/tools available, but honing in on some of these reports and making the necessary adjustments to your ad campaigns will go a long way in optimizing your account.
Still trying to figure out how to make the necessary adjustments to your Google Ad campaigns? Or looking for even more reports like these to take your account to the next level? The expert PPC team at Responsive Inbound Marketing is here to help. Contact us for answers to your Google Ads questions and needs.